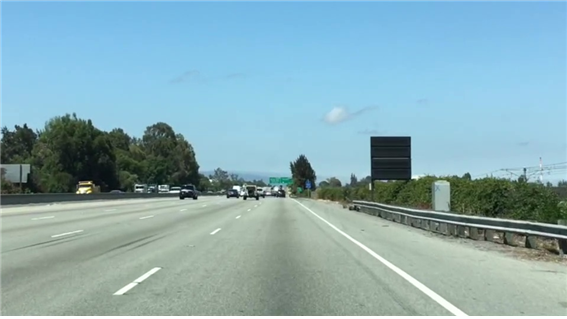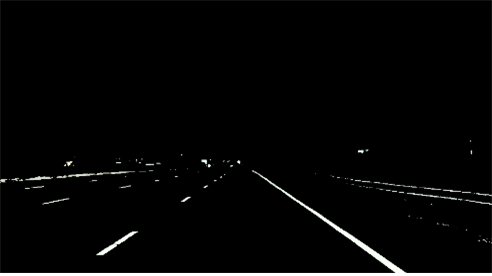
앞의 게시물의 마지막 이미지를 보면 차선 이외에 주변의 많은 다른 픽셀들이 감지되는 것을 볼 수 있습니다. 이를 제거하기 위해 ROI(Region Of Interest), 즉 관심 영역을 지정해야 합니다.
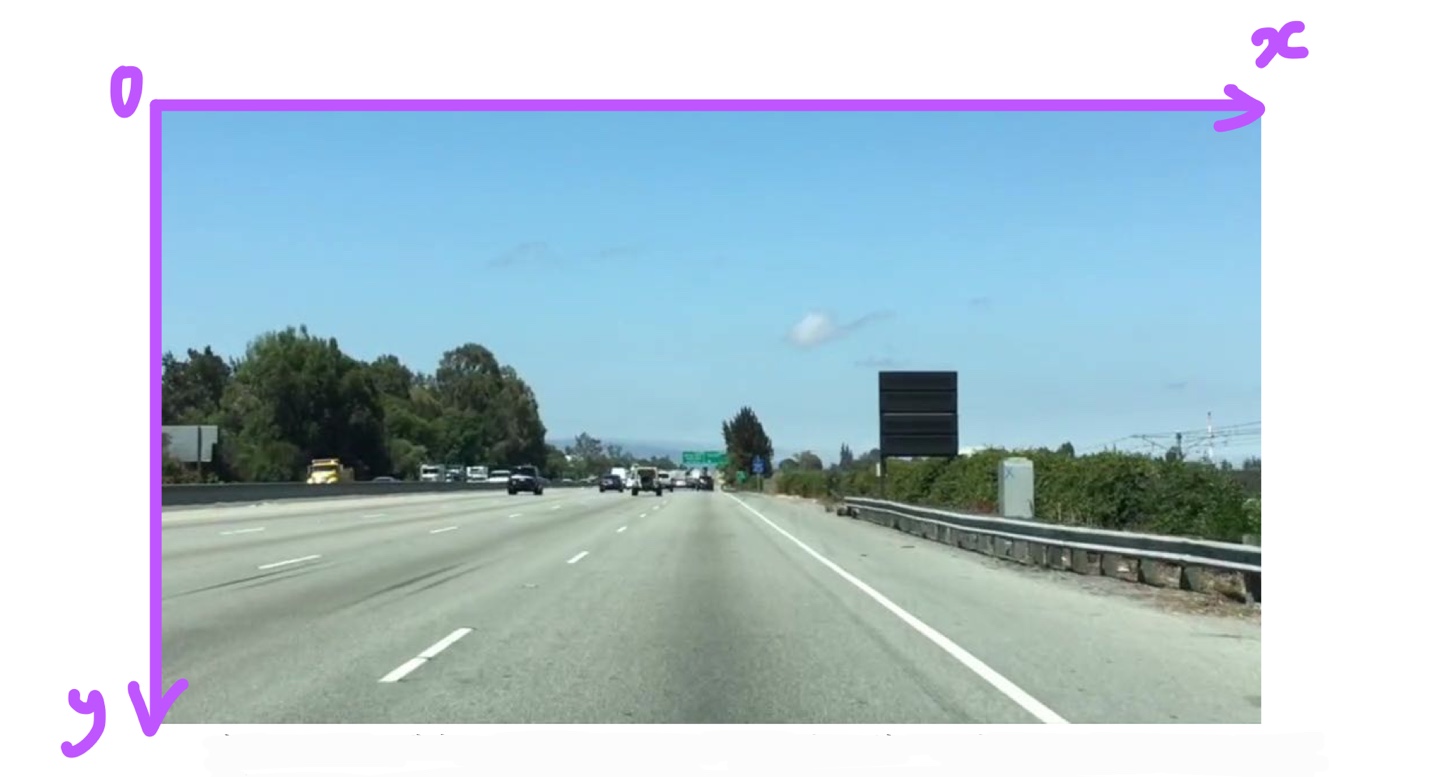
카메라가 차량 전면에 고정돼있다고 하면 차선은 항상 이미지의 동일한 영역에 나타납니다. 보고 싶은 부분만 잘라내어 차선이라고 생각되는 부분만 본다는 것입니다. 여러 모양으로 ROI를 지정할 수 있는데 우선 삼각형으로 만들어보겠습니다. 그럼 삼각형 내부에 있는 흰 픽셀이 차선임을 의미하겠죠?
코드에 적힌 test.jpg 이미지는 차선 인식(1) 게시물에 있습니다.
2021.04.26 - [Udacity/computer vision & deep learning] - 차선인식(1) - 색으로 차선인식
import matplotlib.pyplot as plt
import matplotlib.image as mpimg
import numpy as np

# Read in the image and print some stats
image = mpimg.imread('test.jpg')
print('This image is: ', type(image),
         'with dimensions:', image.shape)

# Pull out the x and y sizes and make a copy of the image
ysize = image.shape[0]
xsize = image.shape[1]
region_select = np.copy(image)

# 삼각형 모양으로 roi 지정하기
# 아래의 세가지 변수를 바꿔가며 삼각형 모양안에 차선이 다들어오도록 만들어 줍니다.
left_bottom = [70, 315]
right_bottom = [497, 315]
apex = [280, 190]

# np.polyfit()함수는 괄호안에 x좌표, y좌표, 차수를 넣으면 두 점을 연결한 직선의 기울기와 y절편을 알려줍니다.
fit_left = np.polyfit((left_bottom[0], apex[0]), (left_bottom[1], apex[1]), 1)
fit_right = np.polyfit((right_bottom[0], apex[0]), (right_bottom[1], apex[1]), 1)
fit_bottom = np.polyfit((left_bottom[0], right_bottom[0]), (left_bottom[1], right_bottom[1]), 1)

# 위에서 그린 선 안에 있는 모든 픽셀을 선택합니다.
XX, YY = np.meshgrid(np.arange(0, xsize), np.arange(0, ysize))
region_thresholds = (YY > (XX*fit_left[0] + fit_left[1])) & \
                    (YY > (XX*fit_right[0] + fit_right[1])) & \
                    (YY < (XX*fit_bottom[0] + fit_bottom[1]))

# 위에서 선택한 픽셀의 색을 빨간색으로 만든다. 즉, roi부분을 빨간색으로 만든다.
region_select[region_thresholds] = [255, 0, 0]

# Display the image
plt.imshow(region_select)

# 그래프가 나타나지않으면 아래의 주석을 풀면됩니다.
# plt.show()
위의 코드를 실행했을 때 결과 이미지는 아래와 같습니다.
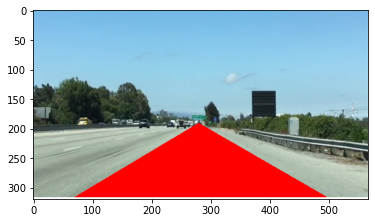
그럼 roi내부를 모두 빨간색으로 하는 것이 아니라 차선만 빨간색으로 만들어 보겠습니다.
import matplotlib.pyplot as plt
import matplotlib.image as mpimg
import numpy as np

# Read in the image
image = mpimg.imread('test.jpg')

# Grab the x and y sizes and make two copies of the image
# With one copy we'll extract only the pixels that meet our selection,
# then we'll paint those pixels red in the original image to see our selection
# overlaid on the original.
ysize = image.shape[0]
xsize = image.shape[1]
color_select= np.copy(image)
line_image = np.copy(image)

# Define our color criteria
red_threshold = 200
green_threshold = 200
blue_threshold = 200
rgb_threshold = [red_threshold, green_threshold, blue_threshold]

# Define a triangle region of interest (Note: if you run this code,
# Keep in mind the origin (x=0, y=0) is in the upper left in image processing
# you'll find these are not sensible values!!
# But you'll get a chance to play with them soon in a quiz ;)
left_bottom = [70, 315]
right_bottom = [497, 315]
apex = [280, 190]

fit_left = np.polyfit((left_bottom[0], apex[0]), (left_bottom[1], apex[1]), 1)
fit_right = np.polyfit((right_bottom[0], apex[0]), (right_bottom[1], apex[1]), 1)
fit_bottom = np.polyfit((left_bottom[0], right_bottom[0]), (left_bottom[1], right_bottom[1]), 1)

# Mask pixels below the threshold
color_thresholds = (image[:,:,0] < rgb_threshold[0]) | \
                    (image[:,:,1] < rgb_threshold[1]) | \
                    (image[:,:,2] < rgb_threshold[2])

# Find the region inside the lines
XX, YY = np.meshgrid(np.arange(0, xsize), np.arange(0, ysize))
region_thresholds = (YY > (XX*fit_left[0] + fit_left[1])) & \
                    (YY > (XX*fit_right[0] + fit_right[1])) & \
                    (YY < (XX*fit_bottom[0] + fit_bottom[1]))
# Mask color selection
color_select[color_thresholds] = [0,0,0]
# Find where image is both colored right and in the region
line_image[~color_thresholds & region_thresholds] = [255,0,0]

# Display our two output images
plt.imshow(color_select)
plt.imshow(line_image)

# uncomment if plot does not display
# plt.show()
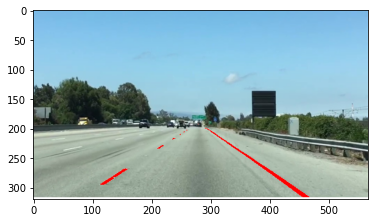
위의 코드의 결과이미지는 다음과 같습니다.
'Udacity > computer vision & deep learning' 카테고리의 다른 글
| 차선인식(1) - 색으로 차선인식 (0) | 2021.04.26 |
|---|